

Most B2B marketers think the fix for underperforming programmatic is a better DSP, a smarter algorithm or a bigger data partner. It isn’t.
Over the last three years we’ve managed $39.6m in managed-service media spend. Our data covers over 1 billion page loads of two different kinds: 402.6 million across 94 B2B vendor and advertiser sites, and 600M+ across the B2B niche publisher sites our campaigns run on. We keep the two apart, and so does the report. I’ve written up what actually happened once that spend turned into traffic, and checked each finding against Gartner, Demandbase, 6sense, Forrester, G2 and the controlled studies on AI search. It’s free for subscribers.
The findings in one minute
Roughly a quarter of raw B2B web traffic is confirmed business engagement once you compound the filters honestly. The rest is noise most reach reporting counts anyway.
37% of accounts come back. Those returners average around 13 sessions each and stay 72% longer per visit. That’s a buying group at work, not a bounce.
Engagement is bimodal. Accounts either bounce or go deep. The second visit is the switch.
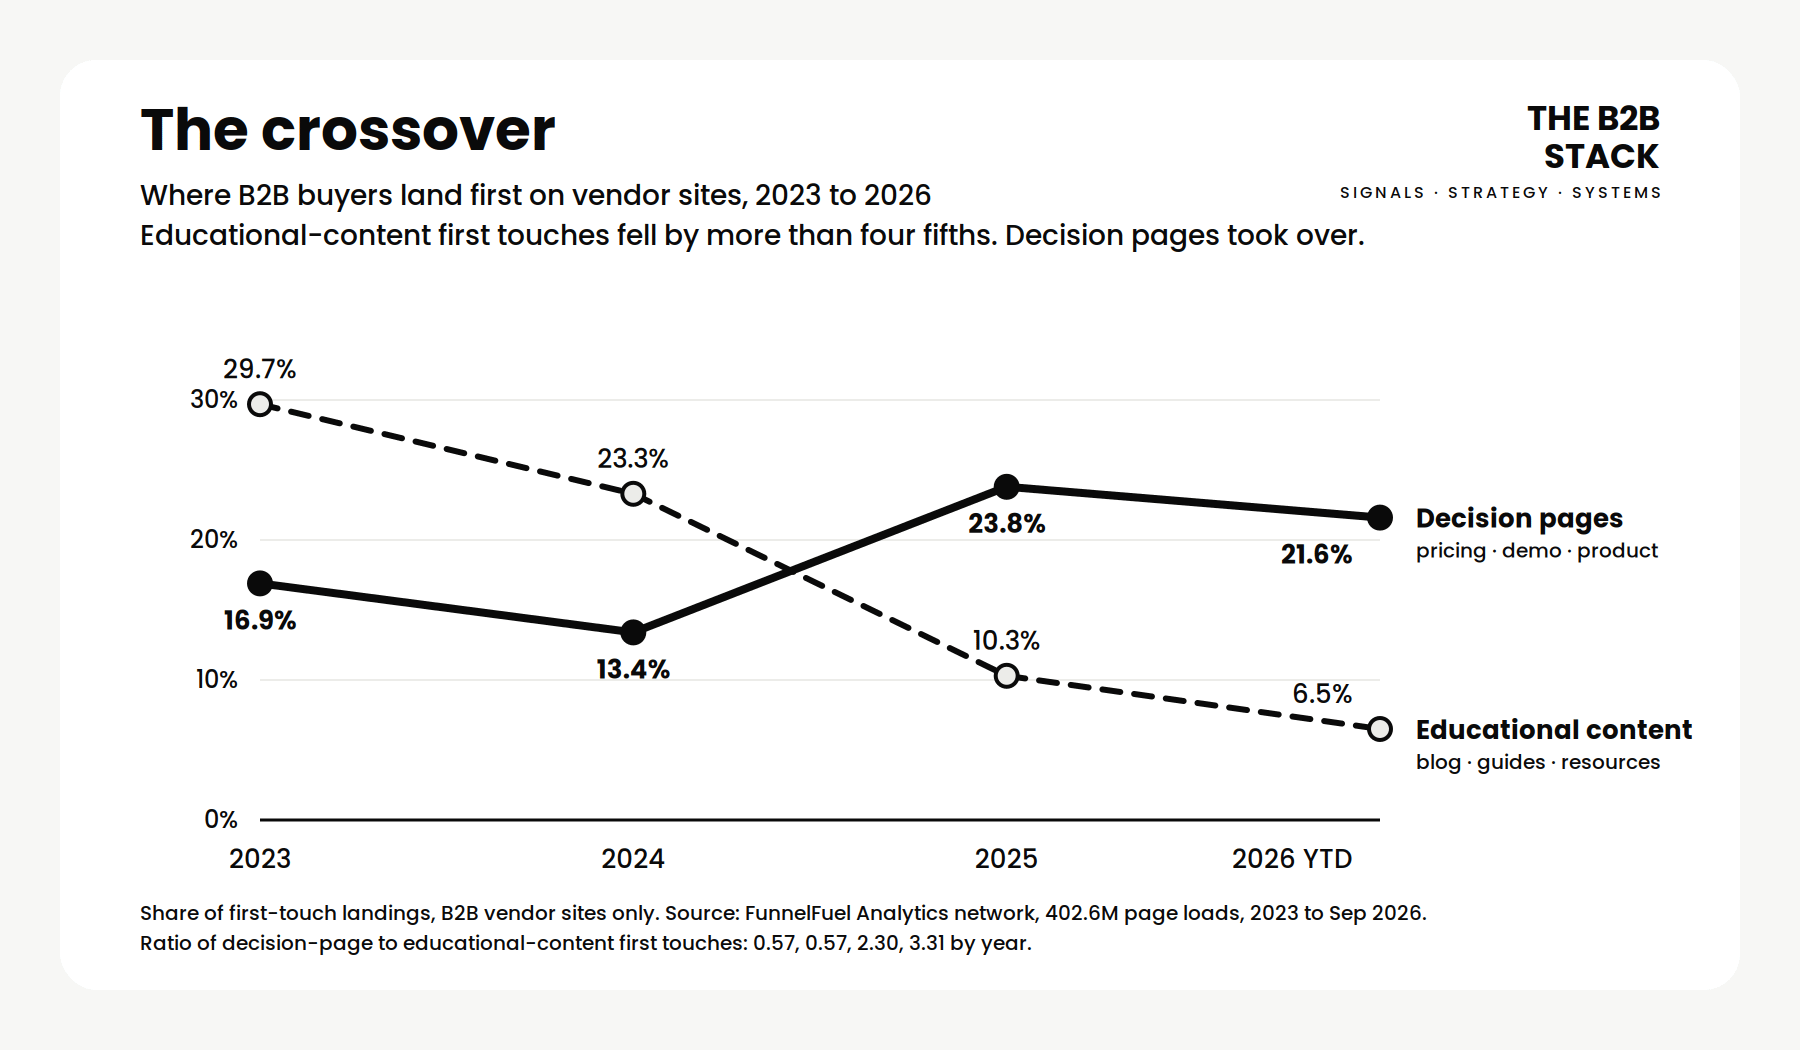
First-touch landings on educational content collapsed by more than four fifths in three years. Decision pages took over. Homepage first touches fell by nearly two thirds in a single year. Buyers arrive late, decided, and deep-linked.
B2B trade publishers have been hit harder than vendors. Article first-touches fell from 79% to 17% of entries in two years, and paid campaigns now deliver nearly half of all tracked visits across the network.
The full report goes further: nine sections with seven takeaways you can use the same week, post-click benchmarks for bounce, dwell, depth and return rate to hold your own campaigns against, and a methods section listing the numbers we won’t fake.
Who it’s for
B2B marketers and demand-gen leads who sign off programmatic or ABM budgets and want to know what they’re really buying
Anyone who has been shown a reach or “accounts identified” number and wondered how much of it is real
Media and agency teams planning on B2B trade publishers, who need to know where the publisher click has gone
Founders and CMOs trying to work out how AI search has changed the way buyers reach their site
It’s not a pitch for any platform or data provider. Third-party intent, first-party signals and the publishers all have a part to play. The report is about measuring all of it at the level where the signal lives: the account.
The claim code is free for subscribers. Pop your email in to get it.